In this blog, I would like to take you through the process of how to go about solving a dataset or a data science problem.
Quora Question pair was actually a competition hosted on kaggle with decent prize money and anybody in the world could participate in it. But the competition is long over and the dataset is available for practice. Though the dataset is quite big in size, it is one of the best datasets to practice your NLP and Machine Learning skills.
We are going to solve this dataset by assuming that it is an industry dataset and we will follow an industry Machine Learning project workflow to solve this dataset. Though here we will not do/ follow the data ingestion process because the data is already given to us in a certain format specifically CSV format. Let’s start with problem identification. So, in the competition description, they have already mentioned what is the problem and what is the objective. For the purpose of better understanding, I will put that below. I will also mention the competition link.
https://www.kaggle.com/c/quora-question-pairs/overview
What is “Quora”? I think people must be aware of the knowledge sharing and gaining platform since it allows us to connect with people from different fields and ask questions of them. It is an enriching platform for someone who is looking for precise answers on specific subjects. A lot of questions are asked on a daily basis and they can be similar in so many aspects. It would save so much time and make user experience extremely efficient.
Business Impact
Identifying questions that are similar or duplicate (they can be worded differently but will connote the same meaning) reduces efforts as quora can associate answers which were previously given to the same question. It saves a lot of time and it will enhance the customer experience.
- What do we need to solve ?
We need to identify whether a pair of questions are similar/duplicate or not. We need to find such question pairs so that it can improve the efficacy of the service.
- cost of misclassification:
The cost of the misclassifications can be very high. Imagine there are two questions Q5 and Q6 they are not similar but we predicted them to be similar, if we predict them to be similar then the answer will get associated with them and can be dangerous and bad for the business.
- Time and Latency
Model can serve with no strict time limitation, of course it will be better if it can serve in no time.
There should be some kind of a threshold value below/after which two questions can be considered similar or dissimilar. You can always go for a probability value.
Reading the Dataset to form/understand a machine learning problem.
First of all, in order to download this data, you need to go to kaggle and download the dataset. They are four files. You need to download Train.csv because that is the one we will be using to train our model and there is another file test.csv that shall be used later. Both of them are zipped with a size of 21 Mb and 17 Mb respectively.
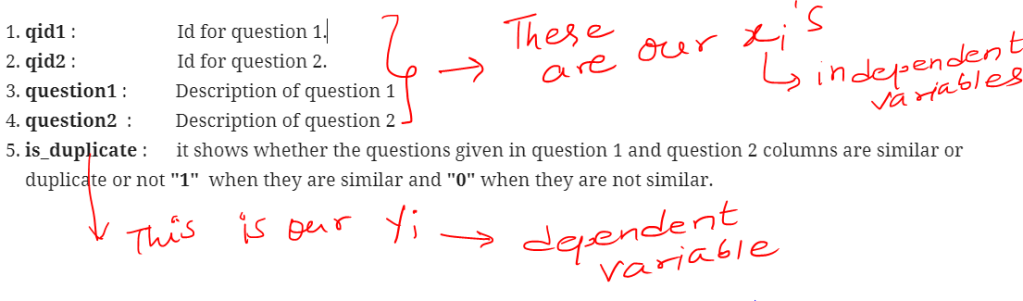
In train.csv there are 5 columns :
- qid1 : Id for question 1.
- qid2 : Id for question 2.
- question1 : Description of question 1
- question2 : Description of question 2
- is_duplicate : it shows whether the questions given in question 1 and question 2 columns are similar or duplicate or not “1” when they are similar and “0” when they are not similar.
From the dataset you can figure out what is our Xi’s are and what is our Yi
So it is a supervised learning problem where we need to classify 0 or 1 for question similarity. o and 1 are two class labels so it is a binary classification problem.
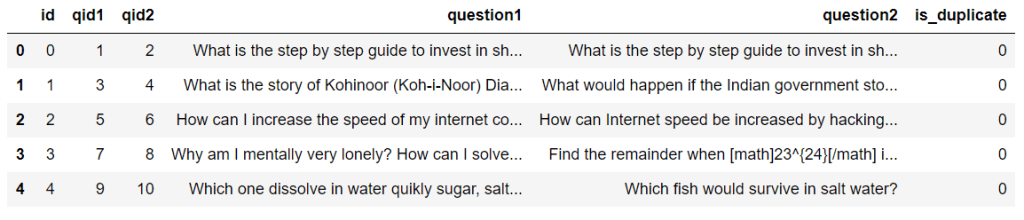
The id column is just taking care of the index.
Since we have figured out the ML problem that it is a binary classification problem, it is time to see the evaluation metric.
https://www.kaggle.com/c/quora-question-pairs/overview/evaluation
Performance Metric
Log Loss
As per kaggle, the performance metric is “Log Loss” and it makes sense since we do not want to predict just 0 and 1. We need probability scores so as to develop some sort of a threshold and whenever probability is involved in a classification setting log loss is the best metric.
And Of course other classification performance metrics will also come in handy like Confusion matrix etc.
Solving the problem/Dataset
Some of the steps to solving any dataset are very simple. They begin by downloading the data to the tool on which you would be working on in my case it is python’s jupyter notebook, depending on the type of file whether it is csv, excel etc. you read the data through python’s library pandas.
One thing that I want to tell you is this is not how it happens in the industry there is a whole process of data ingestion that one needs to follow and the platform can also differ. usually, a team of data engineers and ML engineers work together to get the data in the right format and to the company’s platform.
Here it is a competition data so we don’t need to follow any process to get the data. The data is already given to us.
I will start my jupyter notebook by importing the libraries that are necessary for solving particular data. That is the first thing that I do. Here also I begin by import all the libraries and module which I will require. of course, what all libraries you need well, it comes by practice the more you practice the easier it is for you to think about all the libraries.
Code snippet
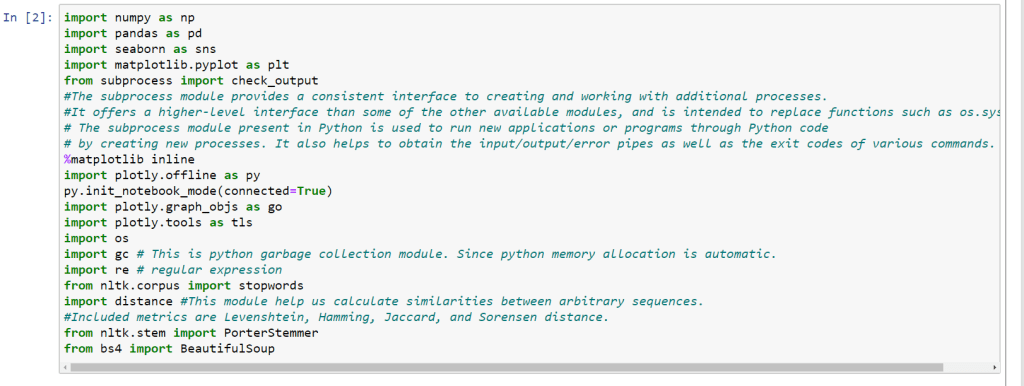
Numpy and Pandas are the most basic libraries if you have come this far in machine learning by now these two names would have crossed your path about a millions times. But just a quick overview numpy and pandas are the two most important libraries for any data analysis in python. Seaborn and Matplotlib these two are used for basic visualization. I have provided short description for all the libraries and what is their significance through comments in my ipynb (interactive python notebook)
More to follow in the next blog post.
